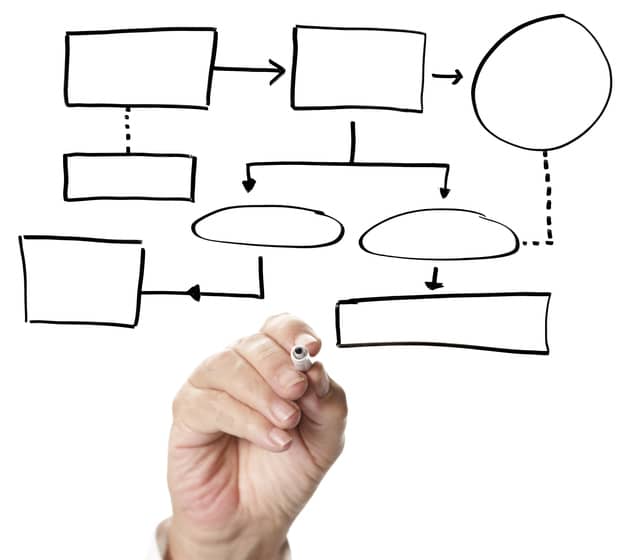
A flowchart (also known as a process flow diagram) is a graphical tool that depicts distinct steps of a process in sequential order (from top to bottom of the page). The basic idea is to include all of the steps of critical importance to the process. Also, flowcharts are often annotated with performance information.
Use: The team would use a flowchart to visualize the process. Remember, much of what Six Sigma and Lean are all about is being able to visualize things that are otherwise not visible. A flowchart is a perfect example of being able to visualize the process.


