An Affinity Diagram is an analytical tool used to organize many ideas into subgroups with common themes or common relationships. The method is reported to have been developed by Jiro Kawakita and so is sometimes referred to as the K-J method.
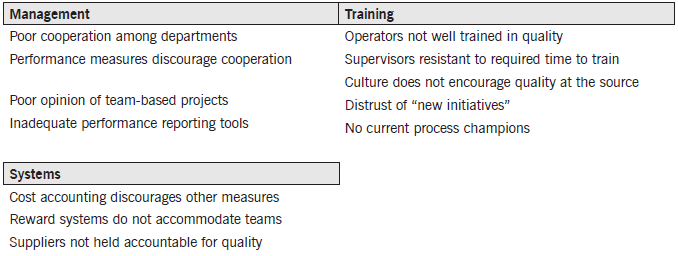
Example 1: Several members of a small company have just returned from a workshop on the methods of Six Sigma. On the trip back from the seminar, the group engaged in a vigorous discussion of the challenges they would confront if they attempted to implement the Six Sigma approach. One person quickly jotted down the list of challenges they generated. The list of brainstormed challenges is given below.

An affinity diagram organizes this list based upon common themes or relationships. For example, an affinity diagram for this example might look as follows.
By organizing the ideas into “affinity groups,” it is much easier to visualize the commonality and plan for and address the challenges to the Six Sigma approach.
Example 2:
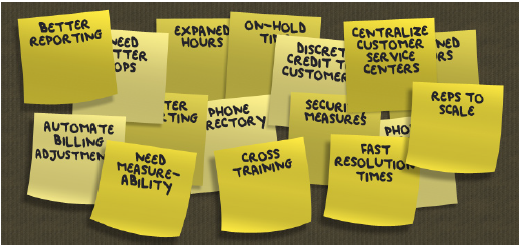
Step 1: First, write down the problem. Then quietly put ideas, data, etc. on cards, pieces of paper, or Post-it notes. The operative word is quietly. This is not like a typical brainstorming session where people are very vocal about their ideas. We want this to be a quiet exercise so that no one person(s) biases the other team member’s ideas.
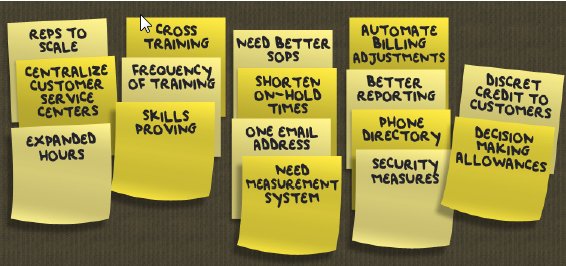
Step 2: Quietly put into homogeneous groupings.
Step 3: Affinity Heading
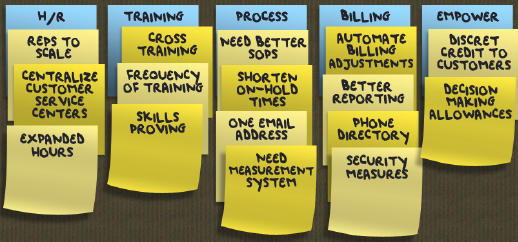
Develop affinity heading cards. For example, there is a homogeneous grouping for human resources related items. There is another grouping for the training department. Another grouping deals with general processing. One grouping has to do with billing. And, the last grouping addresses employee empowerment. The heading cards will be placed on top of each of the homogeneous groupings.
Step 4: Put the groupings into the order of the process. For instance, when employees get hired, they first start off with human resources. The human resources department deals with employee empowerment. And you have the process itself – that goes in the middle. Billing usually comes late in the game. And finally, training is something that involves all employees on an ongoing basis so the team chose to put it in last position.
So what? Now that the team has finished the Affinity Diagram, it is easy to visualize the homogeneous groupings and therefore might help to guide the team towards a viable project.

