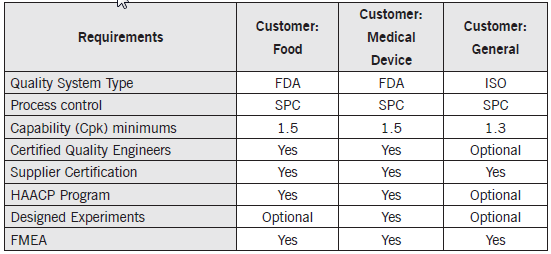
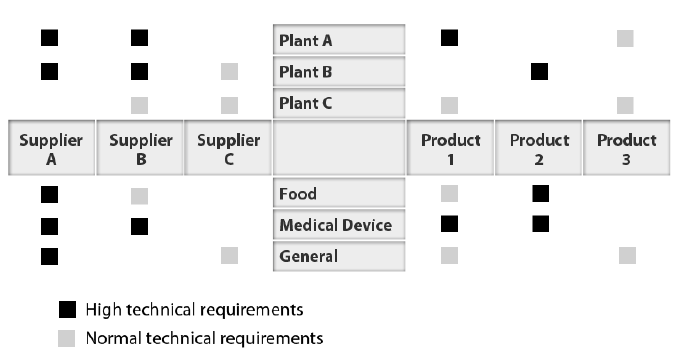
A Matrix Diagram is a tool that illustrates the critical relationships between or among two or more groups. It can be enhanced to show things like the strength of the relationship or the different aspects of the relationship. The basic Y-Shaped Matrix Diagram typically shows the critical relationships of three groups of items in a kind of circular flow.
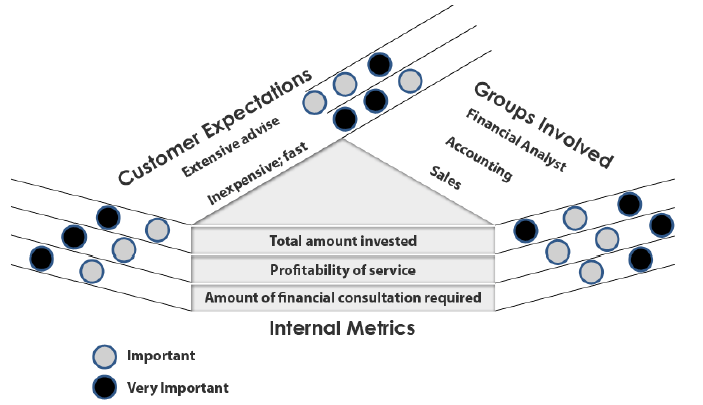
Example: The Y-shaped matrix diagram is illustrated below with a financial services firm that specializes in managing the investments of relatively small investors (that is, less than $1 million). The managing partner wants to illustrate the firm’s internal metrics compared to the customer’s expectations compared to the groups involved in the service delivery. The diagram below illustrates their findings.


