The Moving Average Control Chart is a time-weighted control chart that is constructed from a basic, unweighted moving average. It is often advisable to use the moving average control chart when you desire to quickly detect a change or shift in the process since it is more sensitive to shifts in the process than the traditional average and range control chart (i.e., X-bar and R). Under the appropriate conditions, however, it is not as sensitive as the Exponentially Weighted Moving Average chart (EWMA).
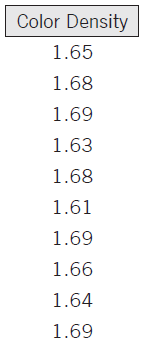
Example: A supplier of food packaging wishes to monitor the average color density of a particular design using the Moving Average Control Chart. Since the measurements are taken once from each roll of packaging, the subgroup size is one. In order to use the Moving Average Control Chart, you must choose the span (the number of values to average at a time) and the company has chosen a span of 3. The data are given below for ten rolls of printed packaging.
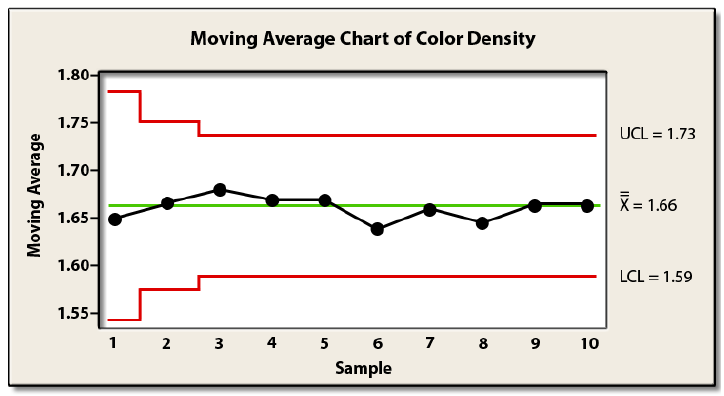
 The control limits are calculated as following. Note that these limits apply for periods greater than or equal to 3; for less than 3, the limits move since you are not averaging three values.
In the formula, μ0 is the target value of average or the overall average of the data that will be used for the center line, σ is the standard deviation of the moving average, and w is the span of the values (three in this case). The Moving Average Control Chart is given below.


