
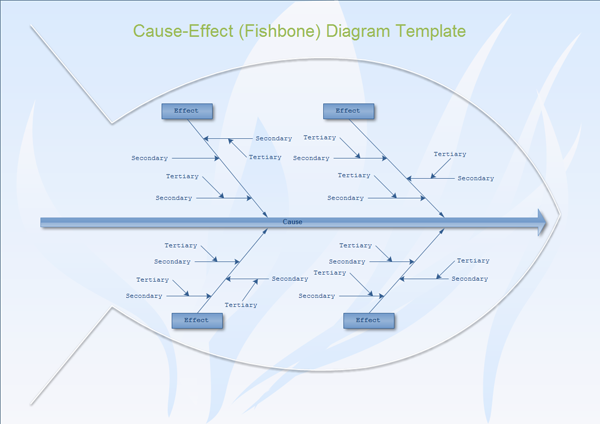
What is a Fishbone Diagram?
A Fishbone Diagram is a visual tool that allows project teams to easily display a list of potential causes of a problem, then break these causes down into increasingly more …

A Fishbone Diagram is a visual tool that allows project teams to easily display a list of potential causes of a problem, then break these causes down into increasingly more …

Students at an Indiana college have taken Six Sigma beyond the classroom and put it to use in improving their college campus. At the Rose-Hulman Institute of Technology in Terre …
Cause-and-effect diagrams are one of the tools that Six Sigma professionals use to obtain the perspectives of individual members of a project team. The cause-and-effect diagram is a graphical brainstorming …
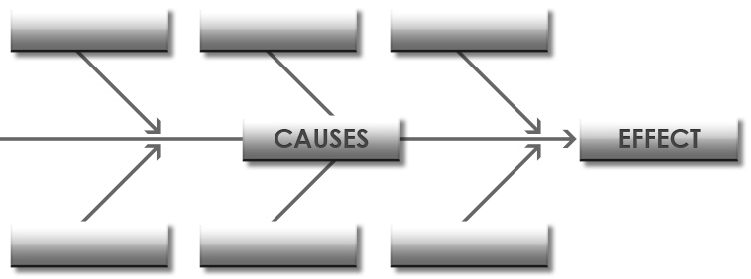
A Cause and Effect Diagram is a graphical tool for displaying a list of causes associated with a specific effect. It is also known as a fishbone diagram or an Ishikawa diagram (created by Dr. Kaoru Ishikawa, an influential quality management innovator). The graph organizes a list of potential causes into categories.