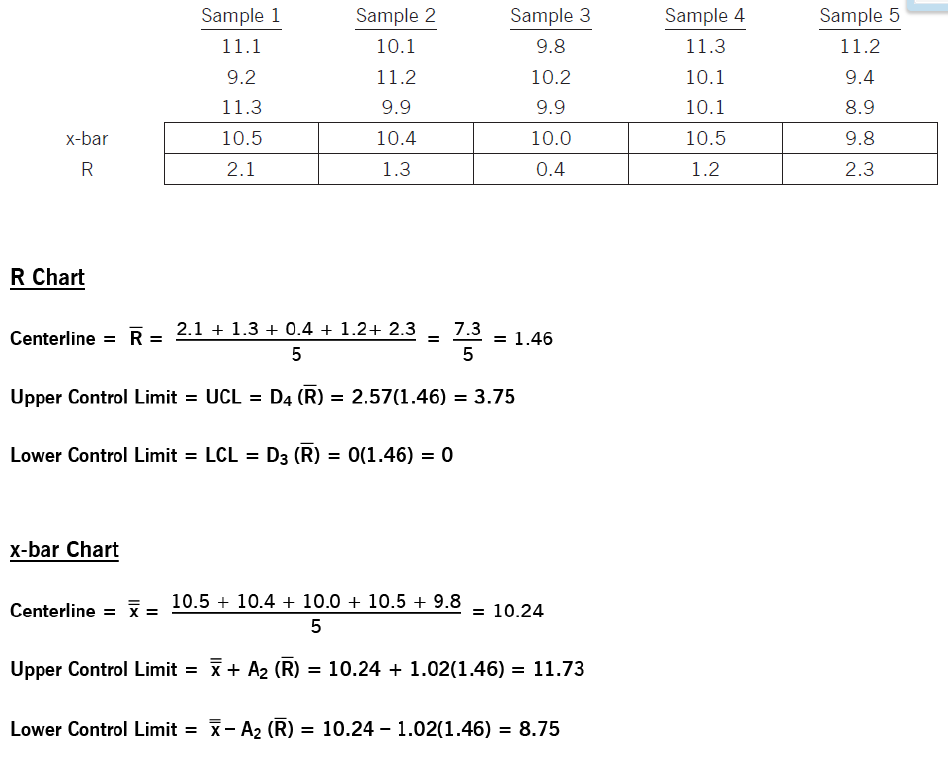
x-bar and R Chart: Example
An x-bar R chart can find the process mean (x-bar) and process range (R) over time. They provide continuous data to determine how well a process functions and stays within acceptable levels of variation. The following example shows how control limits are computed for an x-bar and R chart. The subgroup sample size used in the following example is three.

